Monitoring and Observability with Amazon CloudWatch
What is Amazon CloudWatch?
Amazon CloudWatch is a fully managed observability service that provides data and actionable insights for AWS resources, applications, and services. It enables you to:
- Collect logs and metrics from AWS services and custom applications
- Create alarms based on thresholds or anomaly detection
- Visualize data with dashboards
- Respond automatically to changes using events and rules
CloudWatch plays a central role in diagnosing operational issues and optimizing performance in a distributed, event-driven, or serverless architecture.
Why Use Logging and CloudWatch?
Establishing proper logging and observability with CloudWatch is essential for the following reasons:
Troubleshooting and Debugging:
Logs help you trace issues down to the exact function or event, allowing you to resolve errors faster.Operational Monitoring:
Metrics allow you to track system health — including function invocation rates, latency, and error frequency.Failure Detection:
Alarms notify you proactively of problems like message backlog in queues, throttling, or DLQ overflow.Audit and Compliance:
Logs serve as a historical record of system behavior for audit trails and post-incident reviews.Performance Optimization:
CloudWatch metrics can be used to analyze bottlenecks, optimize compute/memory usage, and reduce cost.
Objective
Implement centralized monitoring and observability for your serverless application using Amazon CloudWatch. This includes:
- Capturing logs from Lambda, API Gateway, SQS, and SNS
- Gathering operational metrics such as invocations, errors, and latency
- Setting up alarms to detect anomalies or failures
- Creating dashboards to visualize system performance and health
Architecture Components Under Observation
The following AWS components should be integrated with CloudWatch:
| Component | Metrics and Logs to Monitor |
|---|---|
| AWS Lambda | Invocations, duration, errors, throttles |
| Amazon SQS | Messages sent, visible messages, DLQ queue length |
| Amazon SNS | Message publish success/failure |
| Amazon API Gateway | Request count, 4xx/5xx errors, latency |
| Amazon S3 | Optional: access logs, request metrics |
Implementation Steps
1. Enable Logging for Lambda Functions
Lambda automatically integrates with CloudWatch Logs if the execution role includes the appropriate permissions.
Required IAM Policy
Ensure your Lambda function’s IAM role includes the following permissions:
{
  "Effect": "Allow",
  "Action": [
    "logs:CreateLogGroup",
    "logs:CreateLogStream",
    "logs:PutLogEvents"
  ],
  "Resource": "*"
}
Verification:
- Navigate to the Lambda function
- Go to Configuration → Permissions
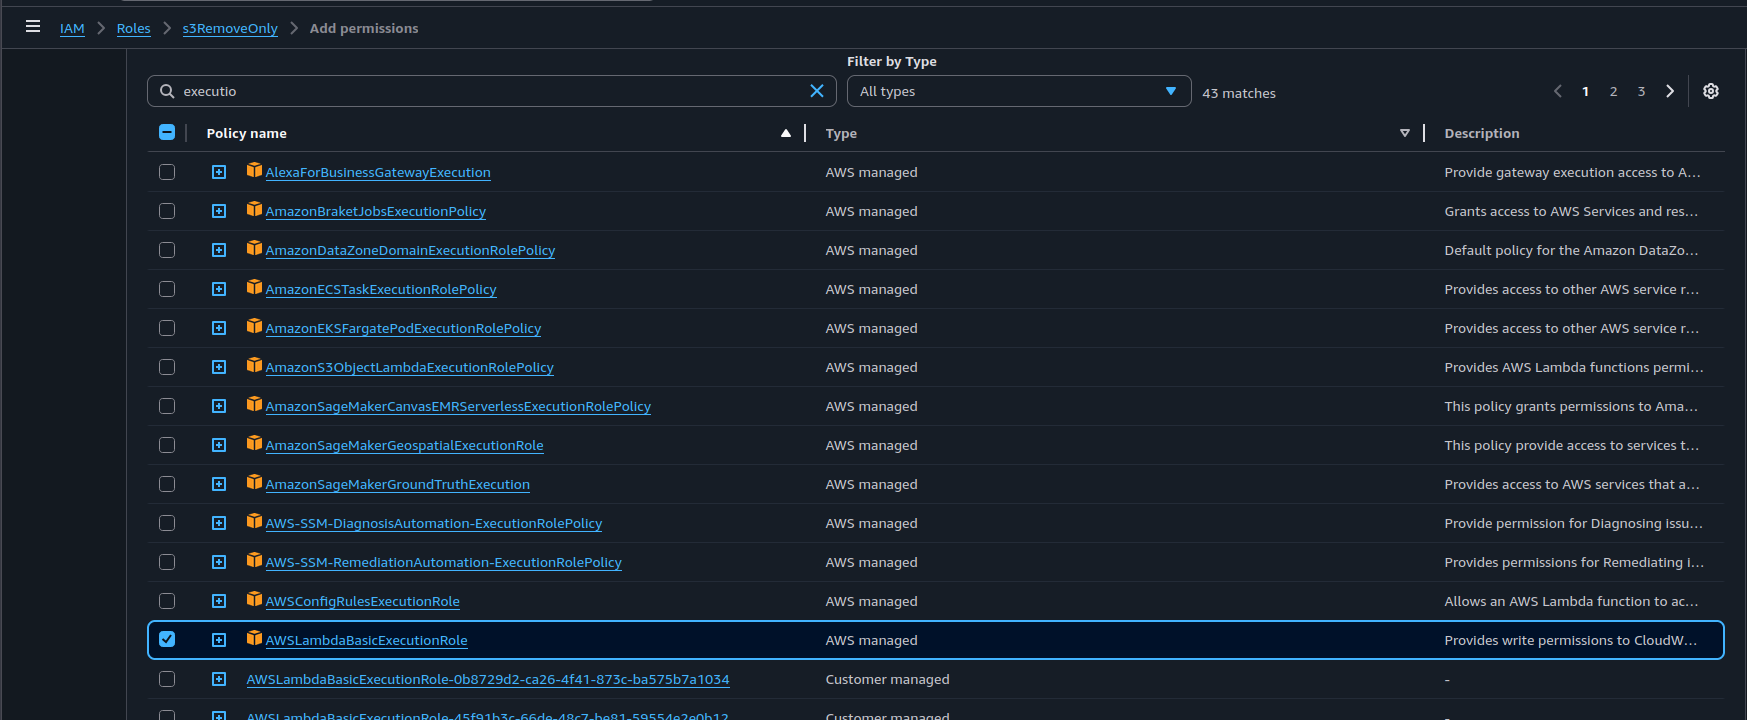
- Confirm the IAM role includes AWSLambdaBasicExecutionRole or equivalent
- If not:
- Go to IAM -> Role -> Choose the role used in Lambda
- Add permissions -> Attach policies
- Choose AWSLambdaBasicExecutionRole then Add permission
2. Create a New Log Group in CloudWatch
Navigate to Amazon CloudWatch via the AWS Management Console.
In the left-hand menu, select (Logs) → Log groups, then click Create log group.
Enter a name for the log group, set the retention policy to 1 day, and choose the Log class as Standard.
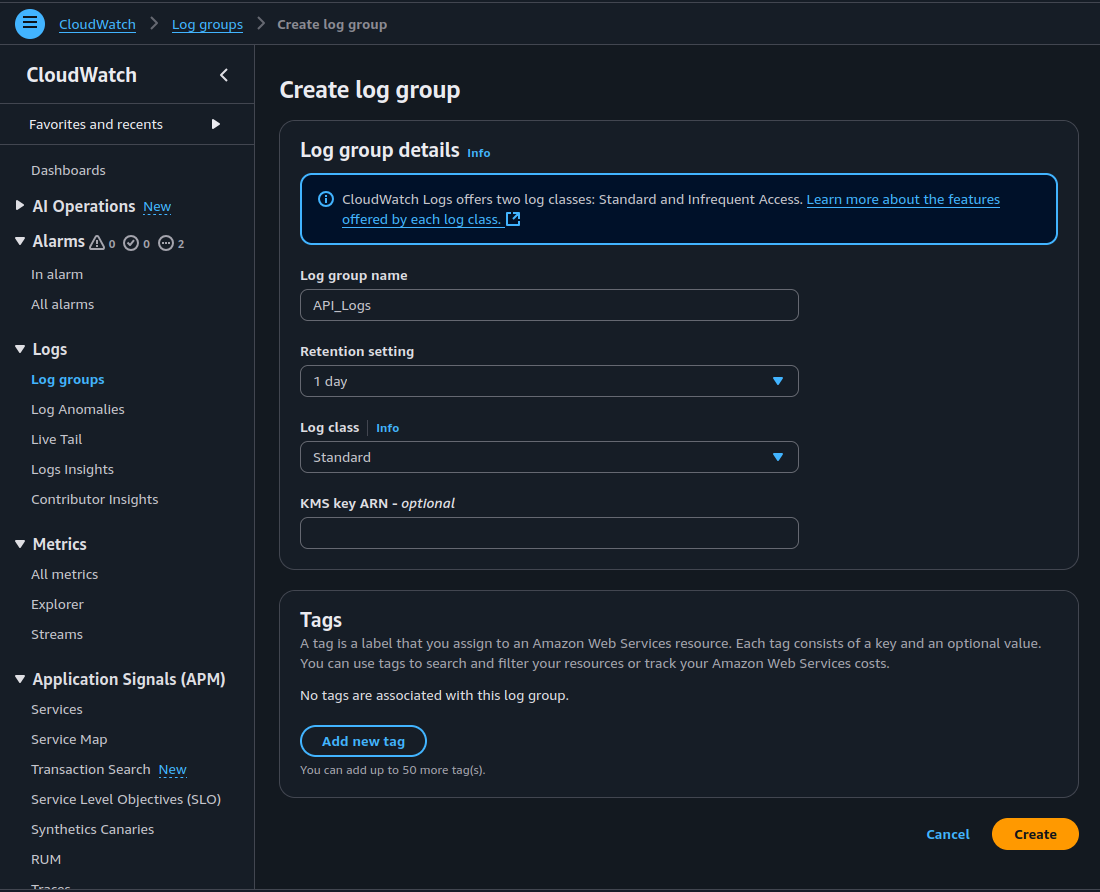
- Click Create, then copy the Amazon Resource Name — ARN of the new log group.
2. Enable Logging in API Gateway
For HTTP APIs:
- Open API Gateway in the AWS Management Console
- Select your API and then the desired Stage
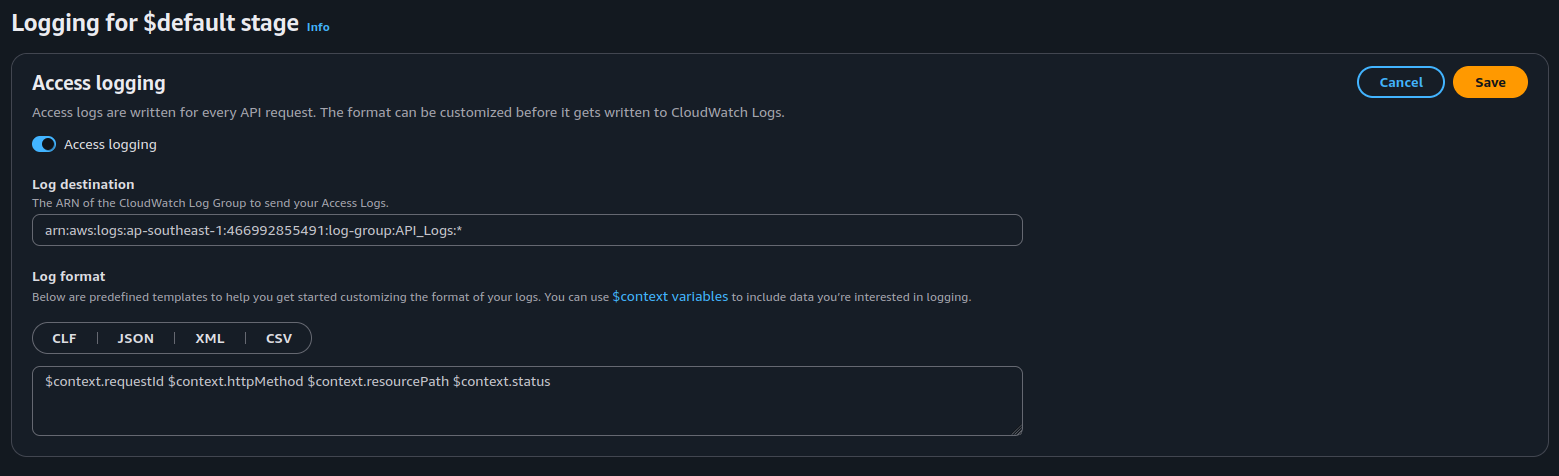
- On the left sidebar, choose Monitor -> Logging:
- Enable Access Logging
- Set Log Level to INFO or ERROR
- Specify a CloudWatch Log Group (create one if necessary)
Recommended Log Format
$context.requestId $context.httpMethod $context.resourcePath $context.status
3. View and Analyze Logs in CloudWatch
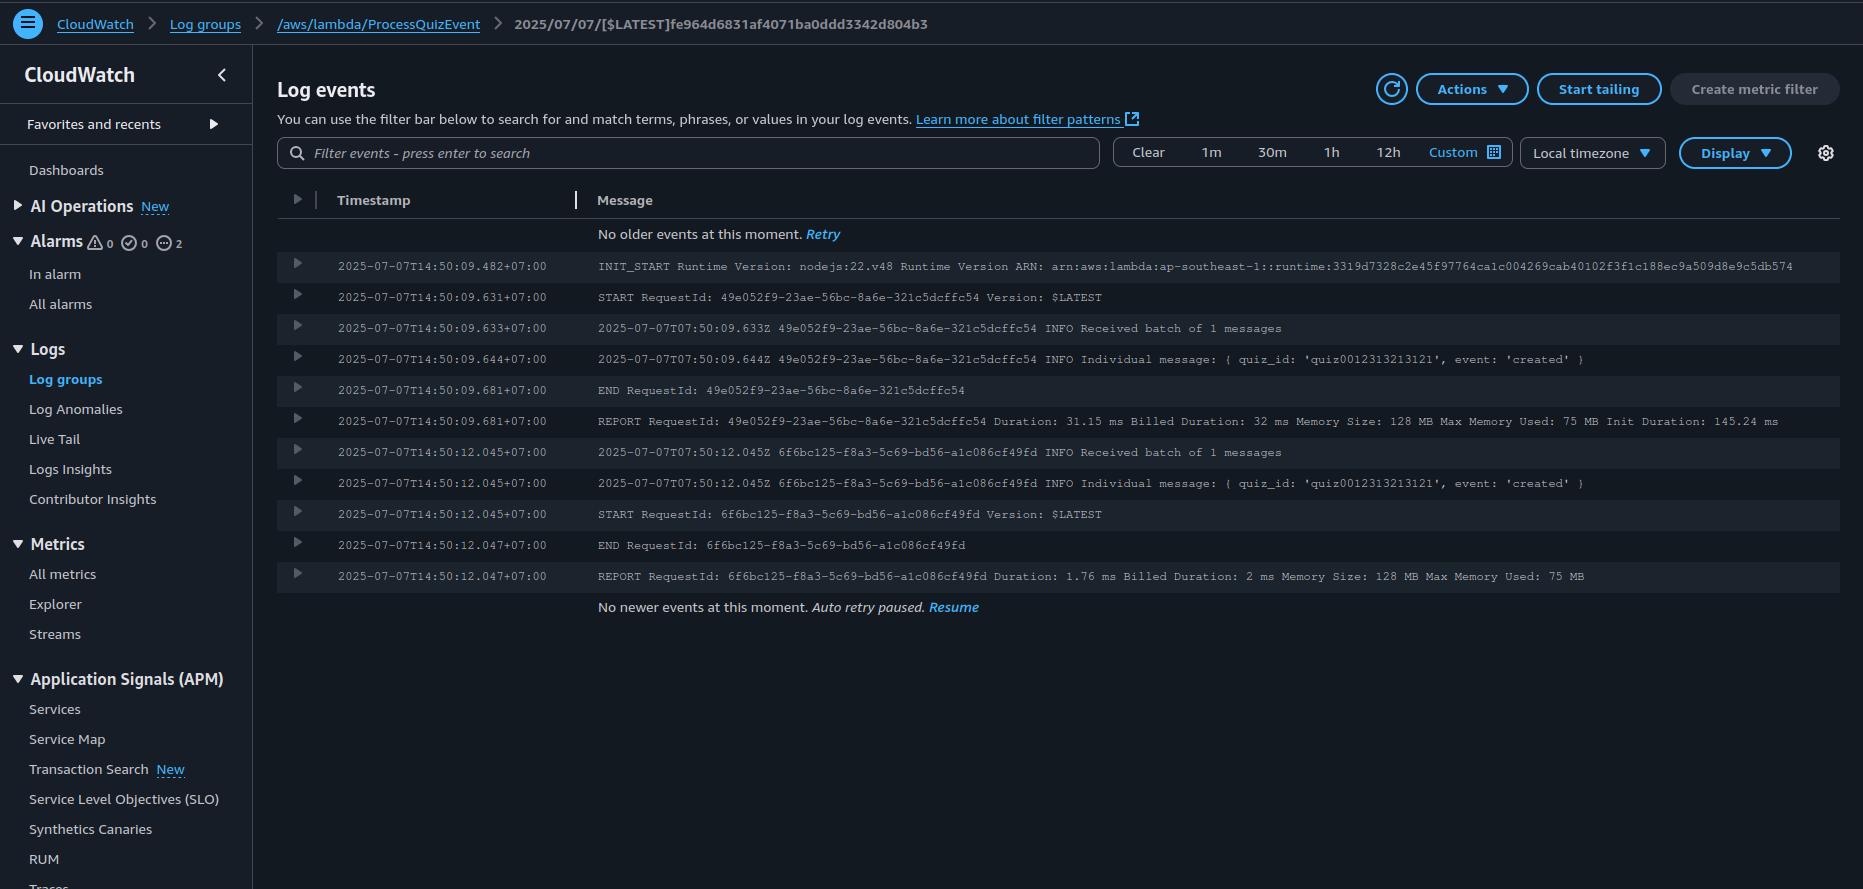
- Navigate to CloudWatch → Log groups
- Locate the log group corresponding to your Lambda or API Gateway (e.g., (/aws/lambda/my-function))
- Open logs to inspect request/response flow, exceptions, or debug outputs
Optional: Use CloudWatch Logs Insights
CloudWatch Logs Insights provides a query interface to search logs. Example query:
fields @timestamp, @message
| filter @message like /error/
| sort @timestamp desc
4. Configure Alarms for Critical Metrics
Set up alarms in (CloudWatch → Alarms) to detect operational issues such as:
| Metric | Description |
|---|---|
| Lambda (Errors) | Triggers when function errors > 0 |
| DLQ message count | Detects if messages accumulate in DLQ |
| API Gateway (5xx errors) | Identifies upstream/internal service issues |
| SQS message backlog | Use (ApproximateNumberOfMessagesVisible) |
Alarms should be tied to actionable alerts (e.g., via SNS topic or email).
5. Build a Centralized CloudWatch Dashboard
Create a custom dashboard in (CloudWatch → Dashboards) with the following widgets:
| Widget Title | Metrics Displayed |
|---|---|
| Lambda Performance | Invocations, Errors, Duration |
| API Gateway Error Rates | 4xx and 5xx error counts and latency |
| SQS Queue Depth | Message count in queues |
| DLQ Monitoring | DLQ queue size over time |
Use these visualizations for a real-time overview of system health and performance.
Expected Results
After implementing the above:
- All application components continuously stream logs to CloudWatch
- Alarms detect and alert on system errors and delays
- Dashboards enable real-time insights into performance and reliability
- Logs and metrics allow for efficient debugging, root cause analysis, and operations monitoring